Spurious correlations: Margarine linked to divorce?
- Published
A website set up by a student at Harvard teaches us to look carefully at statistics. And it's fun at the same time.
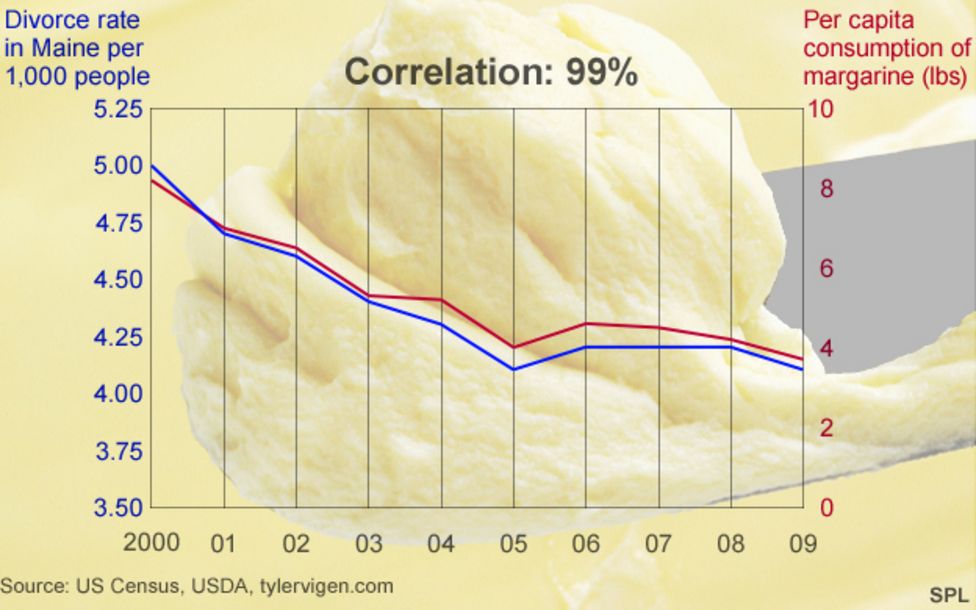
"Margarine consumption linked to divorce." If you saw that headline on a newspaper or website, what would you think?
What if you read a little further and found a compelling graph showing the rates of divorce and margarine consumption tracking each other closely over almost 10 years.
Tempted to believe there could be a link?
"Maybe when there's more margarine in the house it's more likely to cause divorce," muses Tyler Vigen, "or there's a link with some of the molecules in margarine or something."
Vigen is the man behind the margarine graph, which he published on his website Spurious Correlations. The name gives the game away - he's a statistical provocateur.
"I've seen a lot of headlines, especially sensationalist ones - 'Scientists find a connection between x and y,' he says."
"In a lot of those situations there might be a correlation, but it's really important for us to be critical about whether there's a causal mechanism."
One of the golden rules of statistics is that correlation does not equal causation. Just because the movements of two variables track each other closely over time doesn't mean that one causes the other.
To make this important, but somewhat dry, point more accessible, Vigen, a criminology student at Harvard Law School, wrote a computer programme to mine datasets for statistical correlations. He posts the funniest ones to Spurious Correlations.
"What's kind of fun about it is it allows people to be their own scientist for a few minutes, because they get to come up with their own hypothesis," he says.
The site contains plenty of raw material to test out your ability to come up with a creative causal mechanism.
What links rising per capita cheese consumption to the number of people who died by becoming tangled in their bedsheets?
Why do murders by steam, hot vapours and hot objects rise and fall with the age of the winner of the Miss America beauty pageant?
And how does the number of films Nicholas Cage appears in each year influence the number of female editors of the Harvard Law Review?

"We think about that for a second, and realise that we have no basis for that in reality," says Vigen. "There's just nothing that can confirm that for us and we can kind of reject our own hypothesis outright."
Real world examples of the difference between correlation and causation abound. A classic is that in summer, ice cream sales and murder rates rise. The two are correlated, but it's easy to see that neither causes the other. Perhaps there's a third variable - like hot weather - that causes both?
More seriously, when hormone replacement therapy became commonplace, doctors noticed that women taking HRT seemed less likely to get coronary heart disease. Some doctors suggested a causal relationship - that HRT lowered the risk of heart disease.
Again it turned out that there was a third variable at play. Women who were taking HRT were more likely to come from higher socio-economic groups, with healthier diet and exercise habits. It's this that lowered the risk of heart disease. In the end, other tests showed that HRT actually raised the risk slightly.
Vigen's site has attracted lots of attention on social media, where making fun of correlations is a healthy meme. A quick search turns up graphs "proving" Facebook caused the Greek debt crisis, or that a pirate shortage "caused" global warming.
Spurious Correlations goes further in illustrating the pitfalls of our data-rich age.
One is that if you throw enough processing power at a large data set you can unearth huge numbers of correlations.

Many will be statistically significant, meaning that they're unlikely to have occurred by chance alone. But causal relations, where a change in one variable causes a change in the other, are much harder to find.
Another pitfall is the seductive power of graphs. Numbers in datasets can be hard to grasp, but show someone two lines moving up or down in apparent unison and you're halfway to convincing them that one causes the other.
"A lot of my charts illustrate where there isn't a statistically significant correlation but it looks like there is because of how I plotted them on a graph," he says.
Take the graphs of Nicholas Cage's film appearances - there are several on Vigen's website. Cage's appearances only vary between zero and four each year, but by choosing the scale carefully they can be made to track other variables which rise and fall by millions.
"When you only have maybe 10 (data) points to go by, it's not that hard to find overlapping lines that curve or vary together," says Vigen.
So what are Tyler Vigen's tips to make sure the statistical wool isn't being pulled over your eyes?
- Be critical of statistics that you see
- Look for a causal link or mechanism
- Demand a little bit of scientific rigour in showing that there's a strong, statistically significant correlation
Something to bear in mind next time a sensational headline catches your eye.